Friday, Aug 7, 2026, 10:00 PM
SLO-First Infrastructure Monitoring: Why the Method Trumps the Tool
Building monitoring from scratch is rarely about selecting the shinier tool. As highlighted in a widely discussed guide on r/sre, true reliability starts with a methodical, SLO-first approach. The author outlines 7 practical steps that every modern Site Reliability Engineer (SRE) should follow to avoid alerting fatigue and build meaningful observability dashboards.
The 7-Step Reliability Framework
- Define SLIs/SLOs First: Focus on business outcomes (e.g., payment success rates) over raw system metrics like CPU utilization.
- Map Infrastructure: Choose your collection stack (like VictoriaMetrics or OpenTelemetry) based on what you actually need to measure.
- Leverage Auto-Instrumentation: Use OpenTelemetry to accelerate telemetry collection without custom code.
- Unify Labels: Standardize metadata across logs, metrics, and traces to break down observability silos.
- Build RED Dashboards: Prioritize Rate, Errors, and Duration metrics for a clear health picture.
- Alert on Symptoms: Implement multi-window multi-burn-rate alerts (from the Google SRE handbook) to page engineers only when real-user impact is imminent.
- Layer Business Dashboards: Add deep-dive investigation metrics once foundational alerting is established.
Bridging the Gap with Rabbit SaaS
Adopting an SLO-first mindset means focusing on systemic health and preventing silent failures. Here is how Rabbit SaaS’s suite complements this methodology:
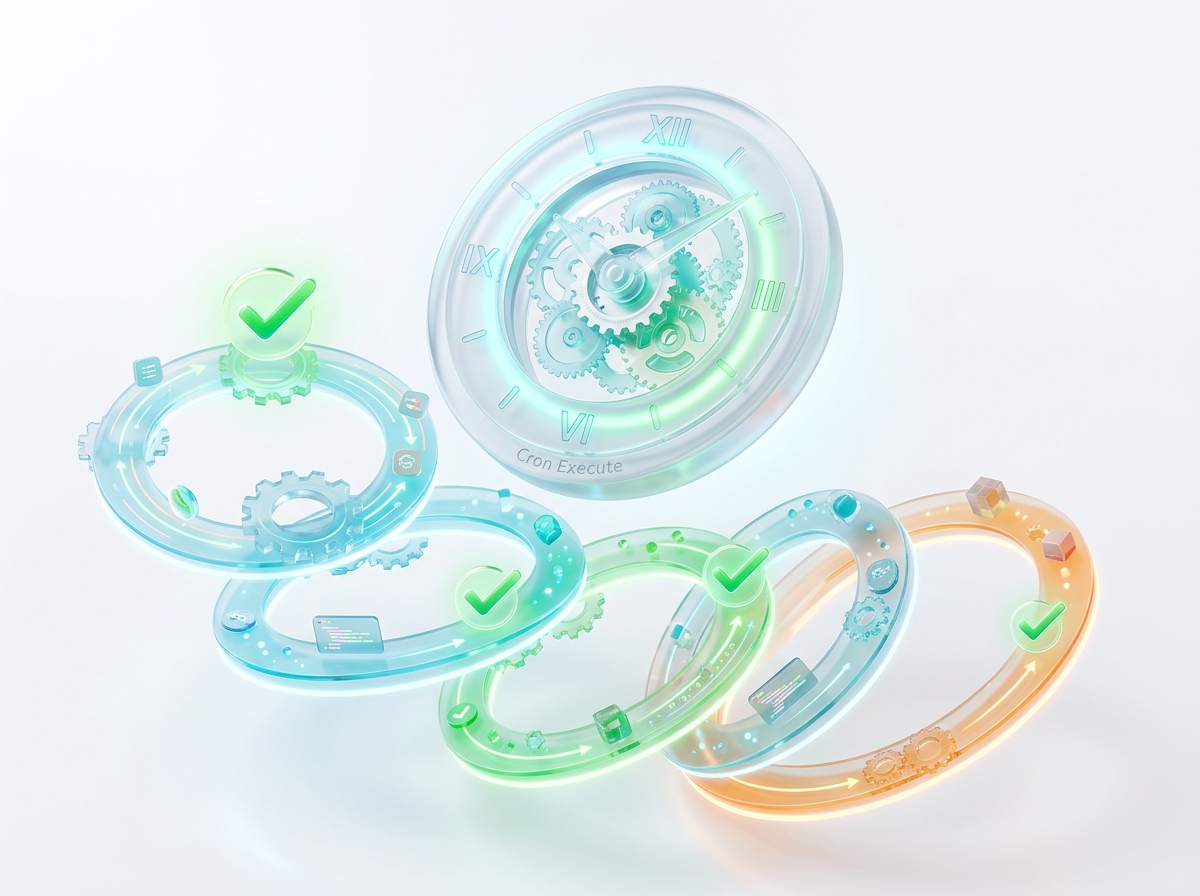
- Prevent Silent SLO Breaches with Cron Rabbit: Many background tasks (like billing reconciliations or daily data syncs) run silently. Standard APM often misses these. Cron Rabbit monitors background jobs via simple curl pings, giving you immediate symptom-based alerts if a critical background job fails to run.
- Isolate Third-Party Noise with CloudStatusHQ: If your payment authorization SLO is breached, is it your code, or is Stripe having an outage? CloudStatusHQ aggregates third-party vendor dependency health, helping you correlate internal telemetry with external system outages.
- Transparent Incident Communication with Status Navigator: When burn-rate alerts trigger and customers are affected, maintaining trust is critical. Status Navigator lets you easily broadcast incident status to your users on custom-branded pages, keeping support queues clear while SREs focus on remediation.
Source Link
www.reddit.com